


CME Group Inc. (CME)
A Derivatives Marketplace with a Moat Worth Considering

Introduction 🎯
CME Group Inc. (CME) is a global leader in the derivatives exchange market. While perhaps not a name on every investor's lips, CME plays a crucial role in the financial world, providing a platform for trading futures and options contracts across a wide range of asset classes. For dividend investors, CME's consistent profitability, strong market position, and commitment to returning value to shareholders make it a company worth a closer look. One thing to flag right away is the relatively low regular dividend, although historically they have delivered on special dividends.
Sector Overview 🏭
CME Group operates in the financial exchange sector, specifically within the derivatives market. This sector is characterised by high barriers to entry, driven by regulatory requirements, technological infrastructure needs, and network effects. Exchanges make money by charging fees for trading, clearing, and data services. Key industry trends include the increasing electronification of trading, the growing demand for risk management tools, and the expansion of derivatives markets into new asset classes. Challenges include regulatory scrutiny, cybersecurity threats, and competition from other exchanges and alternative trading platforms.
Company Overview 🏢
CME Group, as it stands today, is the result of a 2007 merger between the Chicago Mercantile Exchange (CME) and the Chicago Board of Trade (CBOT), with the later addition of NYMEX in 2008. The company's history stretches back to the 19th century, with roots in agricultural futures trading. Today, CME offers a vast array of products, including futures and options on interest rates, equity indexes, foreign exchange, energy, agricultural commodities, and metals. The company has a global presence, with offices and trading floors around the world, but its core operations remain centered in the United States.
Business
How they make money? 💰
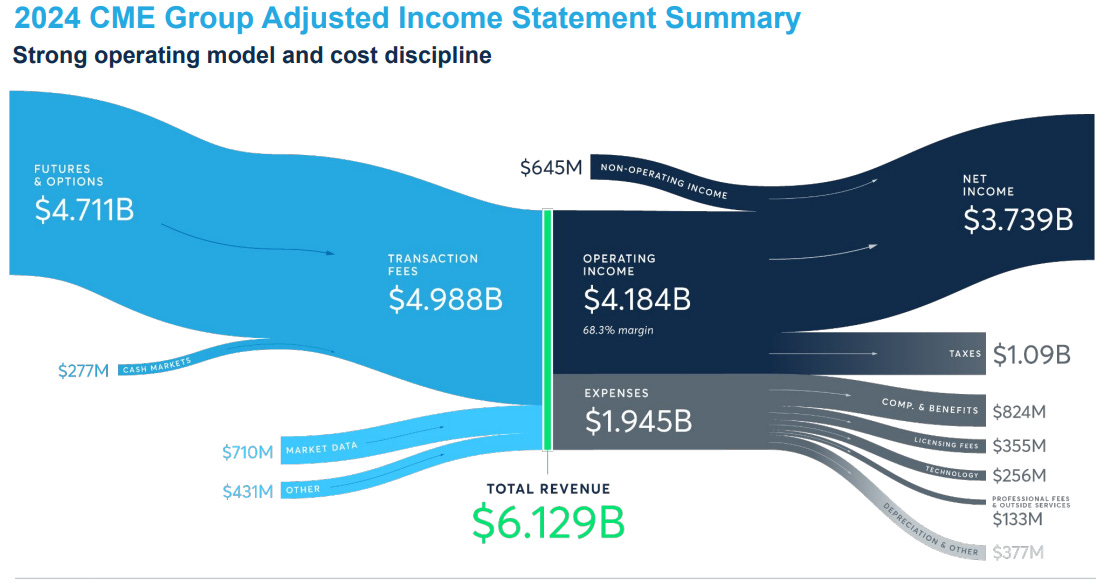
CME Group's primary revenue comes from clearing and transaction fees. Essentially, they act as a middleman, facilitating trades between buyers and sellers of derivatives contracts and charging a fee for each transaction. They also generate revenue from market data services, providing real-time and historical trading data to market participants. Revenue is broken down as follows: approximately 83% from clearing and transaction fees, 13% from market data and information services, and 4% from other sources. Geographically, the revenue is more diversified, with a significant portion coming from outside the United States. The costs associated with revenue generation are primarily related to technology infrastructure, personnel, and regulatory compliance. Business segment margins are not explicitly broken down in detail, but the overall operating margin is substantial. The sustainability of these margins depends on maintaining trading volume, adapting to evolving market needs, and managing operating expenses effectively. Margin growth or contraction can be driven by factors like volatility in the markets (which often leads to increased trading activity), the introduction of new products, and competition from other exchanges.
Key Ratios 📊
CME Group boasts strong profitability. Its gross margin is consistently high, around 85%, reflecting the nature of its exchange business. The operating margin is also robust at 56%, and the net profit margin is a healthy 45%. The company's Return on Equity (ROE) is 14%, and its Return on Invested Capital (ROIC) stands at 13%. These figures are generally higher than many industry peers and demonstrate CME's efficient operations and strong market position. Regarding financial health, CME has a debt-to-equity ratio of 0.16, indicating a conservative approach to leverage. Its current ratio is 1, suggesting it can meet its short-term liabilities. The interest coverage ratio is a very healthy 168. In terms of efficiency, CME's asset turnover is 0.17. While not particularly high, this is typical for a company with significant investments in technology and infrastructure. CME consistently generates strong operating and free cash flow. Benchmarking against a key competitor, Intercontinental Exchange (ICE), CME's profitability metrics are broadly comparable, with both companies demonstrating solid financial performance.
Growth 📈
Over the past decade, CME Group has demonstrated consistent growth, though at a moderate pace.


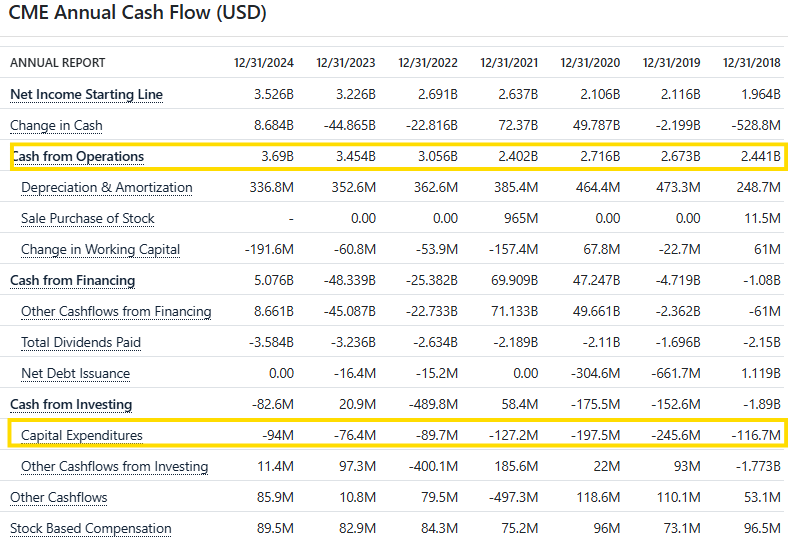
Free Cash Flow and Capital Intensity
Positive trajectory reflecting a growing business linked with increased trading volumes.

Capex to Sales is under 1% and Capex to Cash from Operations under 3%!
Competitive advantage? ⚔️
CME Group's primary competitive advantage lies in its established position as the leading derivatives exchange, its diverse product offerings, its extensive global network, and its robust clearinghouse. The company benefits from significant network effects, as more traders and liquidity on its platform attract even more participants. According to Morningstar, CME has a wide moat. This moat is considered sustainable due to high barriers to entry, high switching costs for customers, and the company's ongoing investments in technology and innovation. Threats to the moat include competition from other exchanges, the emergence of alternative trading platforms, and regulatory changes that could impact trading volumes or fees. Over the last five years, CME has generally kept pace with or slightly outperformed its main competitor, Intercontinental Exchange (ICE), in terms of revenue and net income growth, while demonstrating solid FCF growth.
Management & Culture 🤝
Management 💼
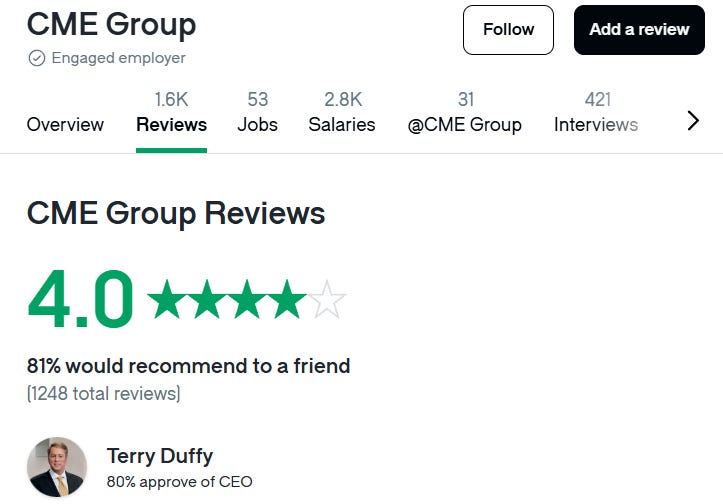
Terrence Duffy has been with CME for over 40 years and CEO since 2004. The board has a mix of experienced professionals with financial and technological expertise. CEO compensation is high but generally in line with the company's performance and industry standards. The CEO has a good approval rating on Glassdoor, at 80%. There is significant insider ownership, and there has been some insider buying reported in the last 12 months.

Aligned with Shareholder interests? 📊
CME has a stated dividend policy and a history of returning capital to shareholders through both regular and special dividends. The company has also engaged in share buybacks, although the consistency and timing of these buybacks could be more clearly defined.

Company Culture
CME Group's stated mission is to "enable our clients to manage risk and capture opportunities globally by providing the widest range of derivatives benchmark products across all major asset classes, with the deep liquidity they require, when and where they need it." While the mission statement is focused on the company's business, it does indirectly address a broader market need for risk management tools. Overall sentiment on Glassdoor is good, with an average rating of 4 out of 5. DEI reviews are mixed, with a rating of 4.1 out of 5. Some recurring themes in reviews mention the fast-paced environment and demanding workload.
Dividend Growth 💹
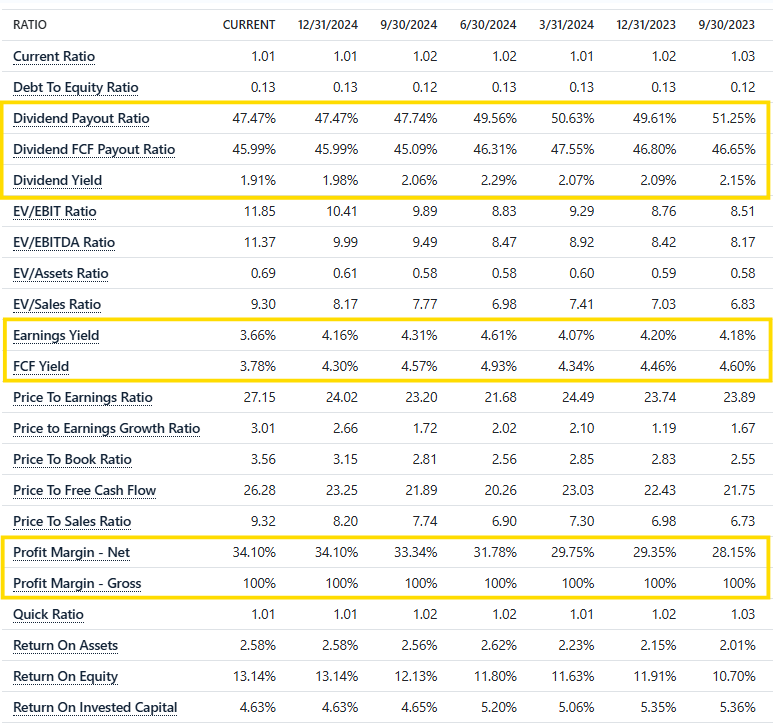
CME has been growing its regular dividend for the past 14 years. However, it's worth noting that a significant portion of its shareholder returns comes in the form of a variable special dividend declared at the end of each year. The current yield on the regular dividend is around 2%, while the yield inclusive of the special dividend can be significantly higher. The current dividend payout ratio is approximately 49% based on earnings and 47% based on free cash flow, suggesting the regular dividend is sustainable. Management has expressed a commitment to returning value to shareholders, and the company's strong cash flow generation supports this.
Valuation 🧮
The current P/E ratio of around 27 is broadly in line with the company's historical average but slightly higher than the sector average, Forwards PE is at 22. The current FCF yield is approximately 3.7%, which is lower than ideal but not unusual for a company with a strong growth profile.
A reverse Discounted Cash Flow (DCF) analysis April’25, suggests the business is fairly to slightly discounted priced.

Risks ⚠️
Internal Risks
CME faces risks related to potential system outages or technology failures, cybersecurity breaches, and operational errors. Any significant disruption to its trading or clearing operations could have severe financial and reputational consequences. Reliance on key personnel and the ability to attract and retain talent are also important factors.
External Risks
The derivatives market is subject to regulatory changes, which could impact CME's business model and profitability. Competition from other exchanges and alternative trading systems is a constant threat. Economic downturns or periods of low market volatility can negatively affect trading volumes and, consequently, CME's revenue.
Agency Ratings
Moody's has assigned CME an Aa3 rating with a stable outlook. Standard & Poor's has assigned an AA- rating with a stable outlook. These ratings indicate a very low risk of default and reflect the company's strong financial position and dominant market position. The stable outlook from both agencies suggests they don't foresee any significant changes in the company's creditworthiness in the near future. Commentary from the rating agencies highlights CME's strong market position, diverse product offerings, and consistent profitability as key strengths.
Conclusion 📌
CME Group is a financially sound company with a wide moat, operating in a growing and dynamic industry. Its consistent profitability, strong cash flow generation, and leading market position make it a compelling investment. While the regular dividend yield might appear modest, the company's history of special dividends and commitment to shareholder returns are attractive features. However, investors should be mindful of the risks associated with regulatory changes, competition, and the inherent volatility of the financial markets. Overall, CME appears to be a worthwhile investment for dividend-focused investors with a long-term perspective, particularly those who value a strong competitive advantage and consistent, if not rapidly growing, dividends.


